


What’s Driving the US Stock Market Growth (or Bloat)?
AI Speculation, Defense Welfare, and Poverty Profiteers


The growth of the US stock market is supposed to signal a healthy economy but, after deconstructing its individual components, its “growth” looks more like the bloat of a rotting corpse. Since the start of the year to 11 July 2025 (YTD), the S&P 500 grew by 5.37 percent on average. It had a median growth of 4.45 percent, a minimum of negative 50.26 percent, and a maximum of 88.99 percent. What drove this “growth”? Artificial Intelligence (AI) speculation, defense department welfare, and companies that profit from the impoverished.

1. AI Speculation
There is no shortage of glowing media coverage for AI. It is heralded as the next big innovation. It’s certainly a hypothesis. But until that innovation converts into real productive value, its unproven. Although private, OpenAI is the dominant AI firm with backing from the public Microsoft. In 2024, OpenAI booked $5 billion in losses on $3.7 billion in revenue. Tech journalist Ed Zitron forecasted that “assuming that OpenAI burns at the same rate it did in 2024 — spending $2.25 to make $1 — OpenAI is on course to burn over $26 billion in 2025 for a loss of $14.4 billion.” In the absence of profitable business models, it’s fair to categorize investment in AI as speculation. In textbook capitalist economics, a healthy economy is determined by profit. If you got a problem with that, don’t take it up with me, go fight the textbook. If companies and products are not making a sustainable profit, that’s usually a bad sign. A red flag that is compounded by the scale of investments.
Any public company that follows OpenAI’s lead, whether in part or in whole, gets the rising tide of AI speculative investment. The market is reliant on this bet paying off even if its promises are sounding more and more like sci-fi. In addition to the direct AI stocks, other companies benefit from this hype. OpenAI and the like run huge server farms to enable their AI systems. This means data infrastructure providers, semiconductor chip manufacturers and electricity companies are derivative beneficiaries.
The top four highest growing stocks YTD were Palantir (PLTR) at 88.99 percent, Seagate (STX) at 70.37 percent, Super Micro Computer (SMCI) at 63.86 percent, and NRG Energy (NRG) at 62.46 percent. Palantir is a military industrial complex (more on that later) data analytics technology that leverages AI. Seagate provides data storage products and solutions like hard disk drives. Super Micro Computer sells enterprise servers and software for them. NRG Energy is an electricity generator that sells to wholesale and retail customers.
Of these four only Palantir was above the median market cap of $37.2 billion at $335.3 billion. The other three had an average market cap of about $30 billion. This explains part of the story. Smaller stocks have more room to grow. Also, since we are deeper into the AI hype cycle, investors are looking for other AI companies to spread their bets for diversification.
After adjusting for market cap weight, the top six stocks are NVIDIA (NVDA) at a YTD growth rate of 19.24 percent, Microsoft (MSFT) at 20.24 percent, Meta (META) at 19.74 percent, Palantir again, Oracle (ORCL) at 38.87 percent, and Broadcom (AVGO) at 18.28 percent. NVIDIA has been the top proxy for AI speculation as the premier chip manufacturer. Given its early identification and rise, it’s only natural that its growth has slowed. There’s only so much you can pump into one stock. Microsoft, as mentioned above, is a proxy for OpenAI given their partnership. The rest are direct AI software plays, infrastructure providers, or chip manufacturers.
It's quite clear that AI is dominating the US stock market. If the sci-fi vision doesn’t pay-off, we are looking at a lot of wasted money and resources. AI is already crowding out and constraining markets. According to PitchBook, AI startups received 53 percent (64 percent for the US) of all global venture capital dollars invested in the first half of 2025. This coincided with venture capital deals getting cut in half from their Q1 2021 highs north of 16,000 to below 8,000. AI deals are sucking up even more dollars too. This pushed the deal value up in the last two quarters. Non-AI startups are getting ignored and crowded out. It is probable that this trend is replicated in the public markets.

Further, for the real economy at large, AI data center demand is straining electricity grids. In December of 2024, Bloomberg reported “AI data centers are multiplying across the US and sucking up huge amounts of power. New evidence shows they may also be distorting the normal flow of electricity for millions of Americans…An exclusive Bloomberg analysis shows that more than three-quarters of highly-distorted power readings across the country are within 50 miles of significant data center activity. While many facilities are popping up near major US cities and adding stress to already fragile grids, this trend holds true in rural areas as well. The digital economy is sucking up so much power that demand is now straining available supplies of electricity in many parts of the world, leading to concerns over price increases and even widespread outages. And that’s only projected to worsen as more data centers are built.”
Your electricity prices are going up, grids are being made riskier, and every other category of business is being crowded out of investment all so speculation-frenzied investors can make a bet that a sector spending $2.25 to make $1 can manifest a sci-fi movie when it’s only discernible use case right now is social media slop. Investors experimenting on AI is not limited to their individual wallets. Their unencumbered speculation is spilling over to the degree that the general public is now expected to be on the hook for their bet.
In addition, the government is directly and indirectly backing AI speculation as seen in Trump’s Stargate Project, the Department of Energy catering regulations to AI expansion, the inclusion of private AI entities in government operations, and overall support. We have speculative investors teaming up with government to bet on a sci-fi experiment that can’t turn a profit and the public is being forced to subsidize and incur its risks. How is this textbook capitalist economics again? Regardless, AI speculation is the top driver of the US stock market.
2. Defense Welfare
Defense related stocks are the next big drivers of growth. Any company that is attached to the traditional military industrial complex or its newer military technology complex is outside textbook capitalist economics. Their revenues are entirely dependent on the government. In the context of the US government being a war hungry imperial hegemon with a spending problem, grafting your business model onto the government’s unlimited money printer is like a cheat code.
Palantir was the obvious recurrence in its number one slot and dependency on government spending. Next in this defense category, Howmet Aerospace, which makes military jet components, grew at 62.18 percent. In December of 2024, they were protested for their role in supplying components for the war on Gaza. General Electric (GE), who also supplies aerospace products and services to the military, grew at 51.5 percent. Huntington Ingalls Industries, Northrop Grumman’s military shipbuilding spin-off, grew at 37.62 percent. Boeing (BA) at 31.98 percent. Aerospace and defense manufacturer RTX (RTX), formerly Raytheon, grew at 26.6 percent.
The US defense budget is the biggest source of graft in all US spending. Although DOGE tried to cut things like national parks for marginal reductions in spending, the thing that no one will touch is the defense budget. That’s the only thing that can meaningfully put a dent in the discretionary spending overruns. Because entitlements and interest are mandatory, the only targetable, sizable, and superfluous category of spending is defense. The US military spends more on defense than the next 9 countries combined, according to the Peter G. Peterson Foundation.
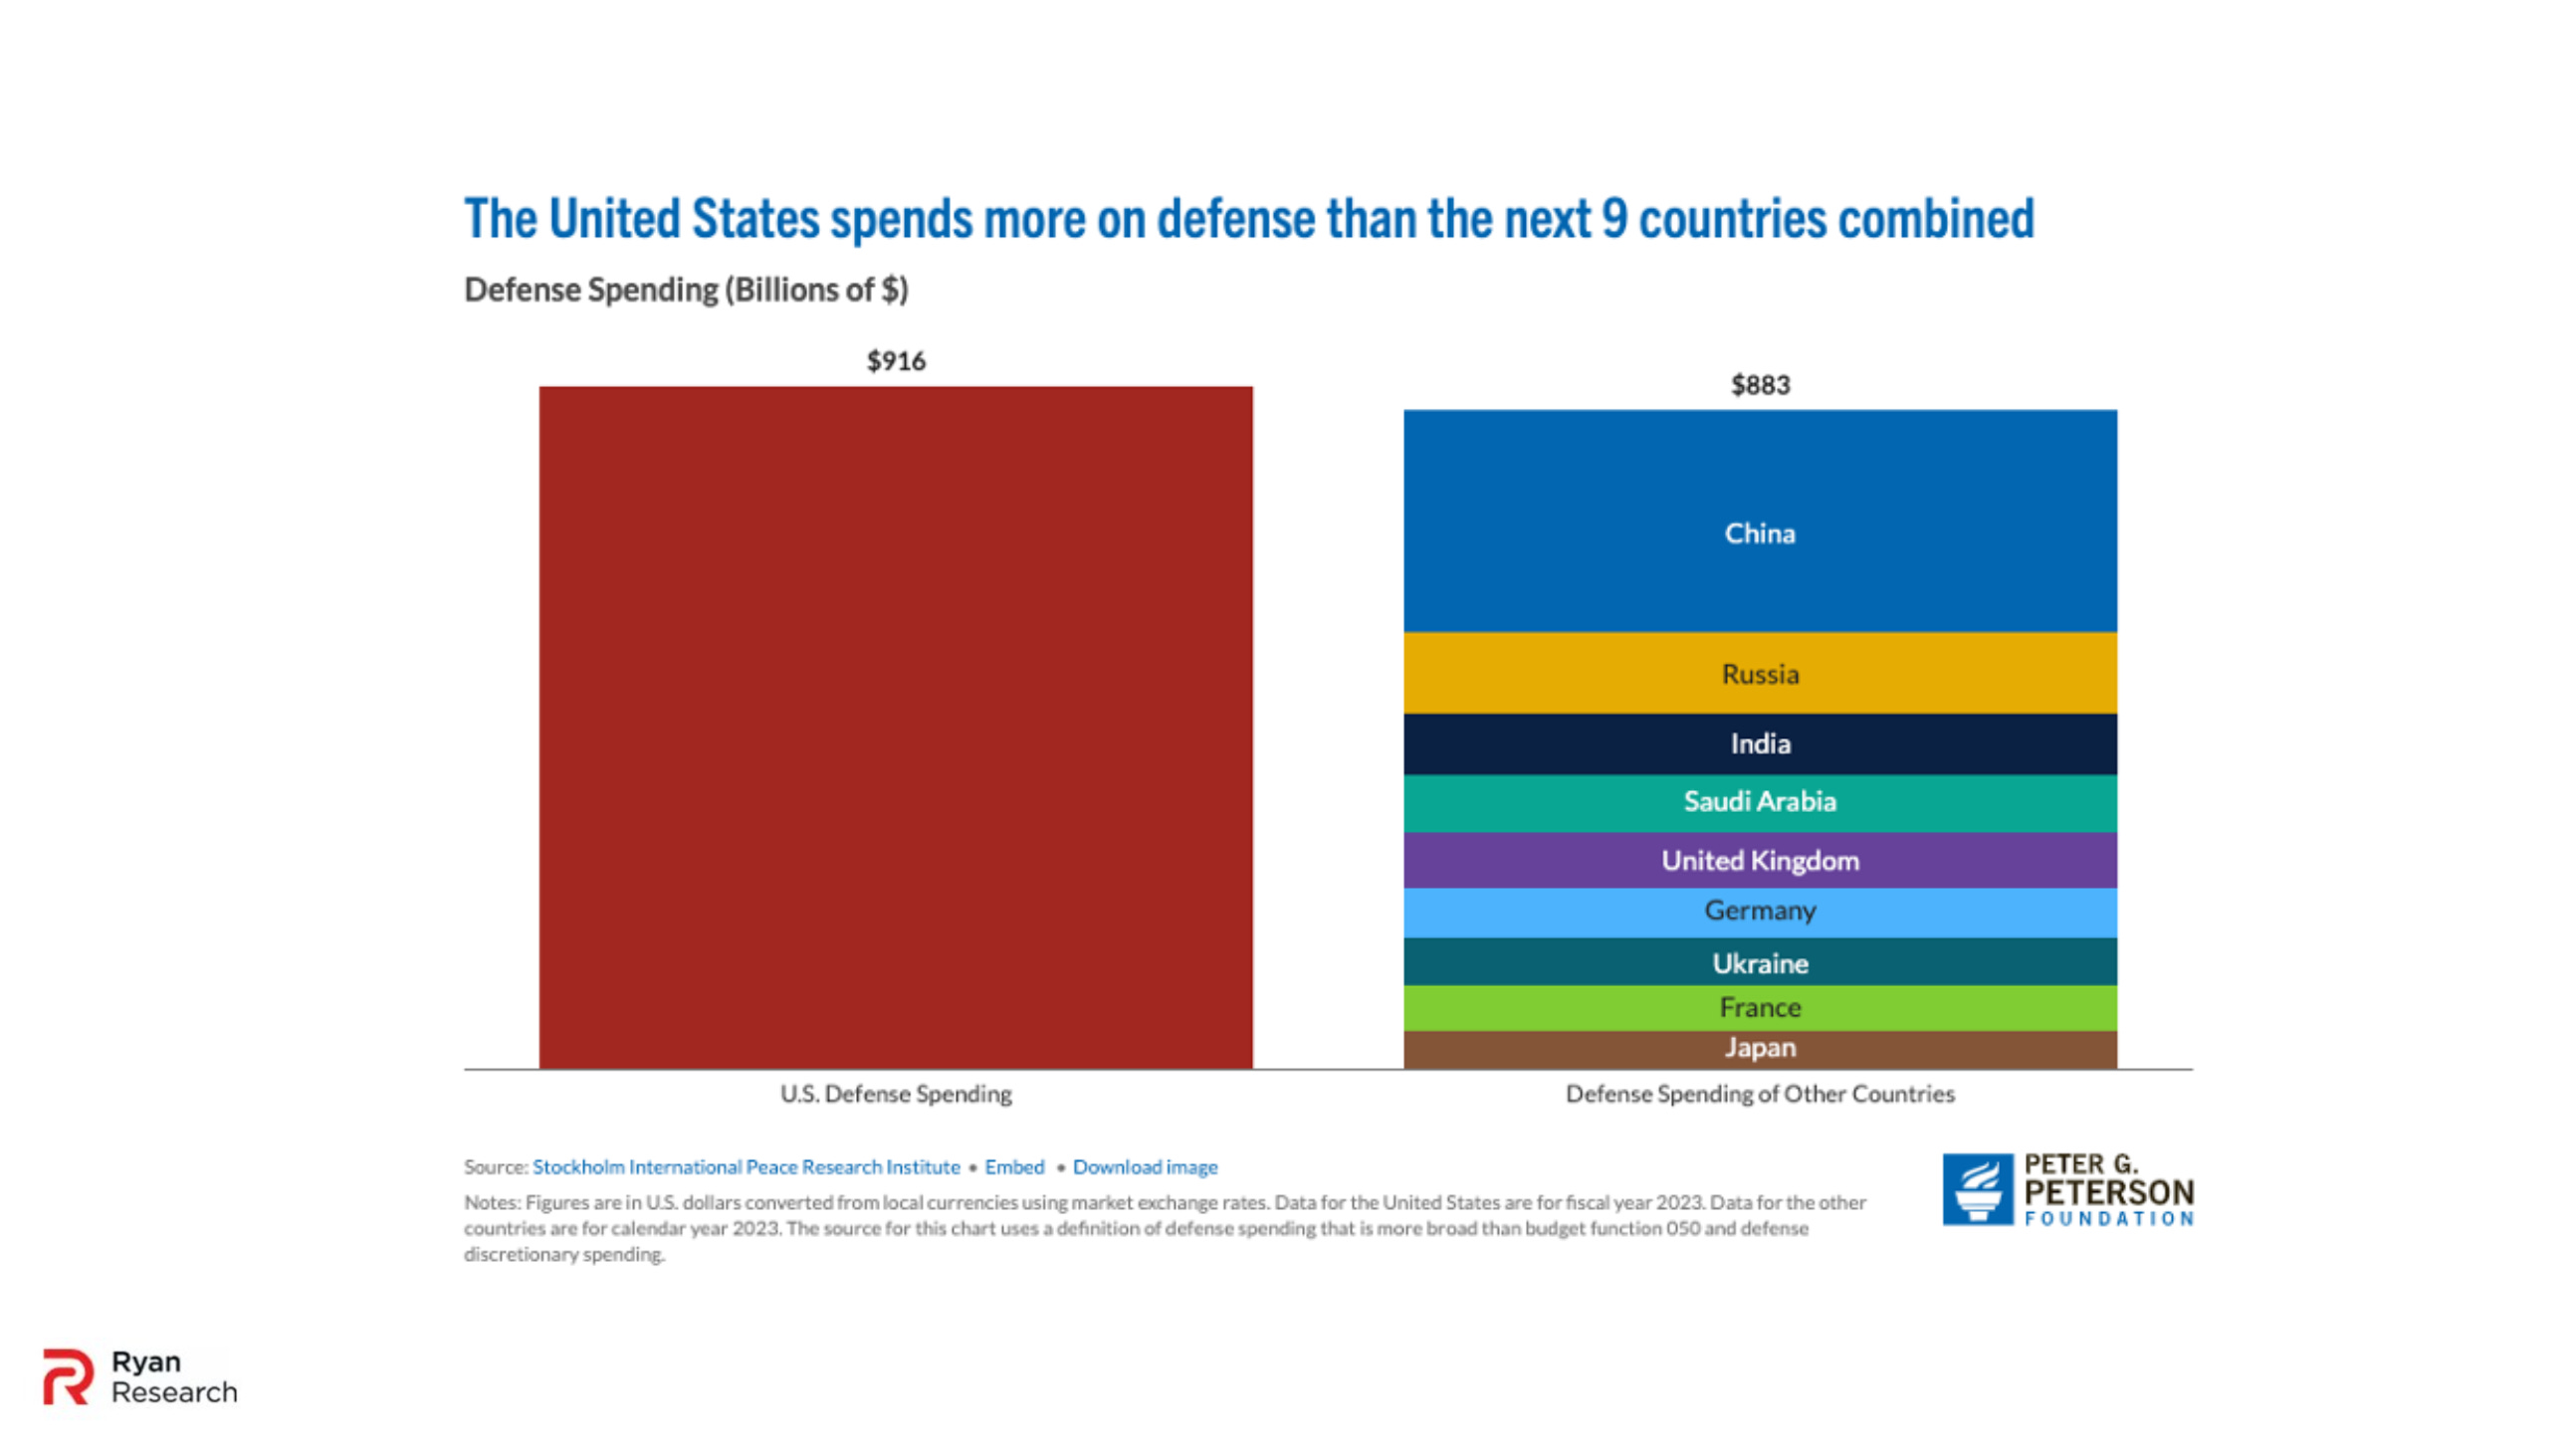
This is obviously the cost of being an imperial hegemon with bases around the world, patronizing proxy wars, and frivolously sloshing around graft. Currently, more Americans think we are spending too much on the military than those that think we spend too little. The US has 750 bases in 80 countries around the world. The methods used to determine spending are outdated and inefficient. As Katerina Canyon wrote in the Guardian, “if the cuts were genuinely an effort to balance the budget…then Congress and watchdog agencies should focus on where the real money is disappearing: failed weapons programs, an over-reliance on private contractors, unnecessary nuclear expansion and a Pentagon budget so massive that it has never passed an audit.”
President Trump was elected on the mandate to make big cuts and curtail the imperial military industrial complex. That hasn’t happened. Instead, “On July 4, President Donald Trump signed what he has called the One, Big Beautiful Bill Act, which Congress had passed the day before… The legislation pushes the total planned defense spending requests and appropriations to over $1 trillion for Fiscal Year 2026 (FY26). It includes a $156.2 billion increase in national defense funding, in addition to the Pentagon’s request for approximately $848 billion in defense spending for FY26. While most of the attention on the defense portion of the bill will go towards the $12.8 billion allocated for Trump’s Golden Dome initiative—the president’s promised missile defense shield over the homeland—and $1 billion to secure the southern border, the bill provides tens of billions of dollars in funding for innovation priorities. This includes autonomous and precise mass systems, an expansion of nuclear weapons modernization, and space capabilities.” (Council of Foreign Relations)
The increased defense spending will be an even bigger opportunity for defense companies to get their snouts in the trough. The inability to cut this spending and then give it to companies that don’t operate by textbook capitalist economics is just government welfare plain and simple. There was also a lot of talk in the MAGA network about industrial policy but, instead of a big push for the consumer market, that industrial policy has narrowed to just propping up defense manufacturers. The point of reindustrialization was to create broad growth of good paying jobs in factories not siphon fiscal stimulus towards a minority of defense cronies. Finally, it is throwing more and more money at technology companies that service the government and military.
“According to the nonprofit research organization Tech Inquiry, three of the world’s biggest tech corporations were awarded approximately $28 billion from 2018 to 2022, including Microsoft ($13.5 billion), Amazon ($10.2 billion), and Alphabet, which is Google’s parent company ($4.3 billion). This paper found that the top five contracts to major tech firms between 2019 and 2022 had contract ceilings totaling at least $53 billion combined. From 2021 through 2023, venture capital firms reportedly pumped nearly $100 billion into defense tech startup companies — an amount 40 percent higher than the previous seven years combined. This report examines how Silicon Valley startups, big tech, and venture capital who benefit from classified Defense contracts will create costly, high-tech defense products that are ineffective, unpredictable, and unsafe – all on the American taxpayer’s dime.” (Brown University)
There’s been a noticeable vibe shift in Silicon Valley. While never perfect, there was a focus on consumer and enterprise technology a decade ago. There was an emphasis on getting your startup to a sustainable business model within the private market. However, it’s possible the venture capital economics were never meant to work outside of Zero interest-rate policy (ZIRP). According to Bain & Company “under 1% of unicorns are profiting at scale with true business success.” The Chicago Booth Review wrote, “only a small percentage of unicorns are profitable, and their loss-making business models have been called into question by many observers.” If technology companies are no longer able to make their business models work, then it seems like they are naturally evolving to seek out bailouts from the infinite tap of the government’s defense budget.
3. Poverty Profiteers
The final category is the collection of poverty profiteers gaining from the impoverishment of the general population. These are companies that offer underemployment or vices. While the unemployment rate is at a relatively good level of 4.1 percent, that is more the function of our new modern economy. There was not as much freelance gig work for people in the past for people that fall out of their desired jobs.
According to global outplacement and business and executive coaching firm Challenger, Gray & Christmas, “U.S.-based employers announced 93,816 job cuts in May…up 47% from 63,816 announced in the same month last year…Technology continues to be a leading job-cut sector as it faces mounting and rapidly changing disruptions. Technology companies announced 10,598 job cuts in May for a total of 74,716 cuts in 2025. This is up 35% from the 55,207 cuts announced during the same period last year.” The economy is hurting. People are getting laid-off and companies are freezing their hiring. While providing workers with some income as a fall back, these freelance gigs are not ideal situations. The economy appears to be employed at a healthy level, but many people are severely underemployed. Their human capital is misallocated to ride-sharing and delivery drivers rather than what their skills would suggest.

Uber (UBER) grew at 51.01 percent and DoorDash (DASH) at 40.9 percent. The Business of Apps reported, “156 million people use Uber or Uber Eats once a month, an 13.8% increase year-on-year. Uber drivers completed 11.27 billion trips in 2024, almost two billion more than in 2023.” The amount of Uber drivers has grown by 36 percent since Q1 of 2023. Recently, a user on the subreddit /uberdrivers wrote:
“Not to be a Debbie Downer, but as inflation takes a bite out of everyone’s wallet, more folks are looking for that easy side gig, or even just a gig because they’re not employed…Additionally all the ride share companies are well aware of this, and make adjustments in the pay scale accordingly to offset the supply and demand side of the equation. This is why we are seeing average dollars per mile drop, and our time being worth less. Unfortunately, unless your one of the lucky ones to be in a unique market, your stuck with take it or leave it options.”
This anecdote corroborated that Americans are falling back on these freelance gigs which excludes them from being counted as unemployed. On top of that, they are getting what little income they can get squeezed by these companies, as the Reddit user pointed out. Other reports have circulated on how these companies constantly squeeze their gig drivers out of money. There are many Americans feeling hard times which leads to them seek out lower costs in their shopping.
Discount retailer Dollar General (DG) grew at 49.6 percent. Dollar Tree (DLTR) grew at 43.01 percent. PYMNTS reported that, “Dollar General’s same-store sales increased 2.4% and its financial results exceeded internal expectations in the quarter ended May 2, as higher-income consumers came to its stores in search of value…the retailer saw the highest percentage of higher-income, value-seeking customers it has seen in four years.” No one is going to Dollar General because they are attracted to its ambiance. People are forced to shop there. This report strikes me as saying people are falling down the income ladder likely due to layoffs, pay cuts, and hiring freezes. The Wall Street Journal reported the same effect with Dollar Tree.
Next, cryptocurrency exchange Coinbase (COIN) grew at 50.48 percent and tobacco seller Philip Morris (PM) grew at 48.56 percent. These are vice companies. Coinbase is a glorified casino. People with no better prospects in the real economy are turning to it as a slot machine. They are trading valueless digital tokens with the philosophy of they’ll either make or break it. This is part of the wider gambling addiction trend that includes sports betting apps. Philip Morris provides the same old nicotine addiction that people facing hardship turn to for an easy feel-good emotion. They’ve also innovated these cancer sticks by reconceptualizing them as electronic cigarettes (e-cigs) or vapes and nicotine pouches. It owns the brands VEEV ONE, IQOS, and Zyn. These are accessible vices. You don’t need much to trade on Coinbase and it’s right there on your phone. It goes without saying how accessible Philip Morris’ products are. Vices are the accessible luxuries of the impoverished.
Finally, luxury retail brands counterintuitively grew. Tapestry (TPR), who owns Coach, Kate Spade, and Stuart Weitzman, grew at 49.98 percent. Others like Ralph Lauren (RL) grew at 23.94 percent and Estée Lauder (EL) at 23.11 percent. While the prior paragraphs discussed the impoverishment of the general population that necessarily doesn’t mean the rich can’t get richer. This month Barron’s Abby Schultz wrote The World’s Rich Are Getting Even Richer: “Surging U.S. stock markets fueled the growth of wealth in North America…the ranks of those with at least $1 million in investible assets grew by 7.3% to 8.4 million last year, up from 7.9 million in 2023…the wealth held by these rich folks grew 8.9% to nearly $30 trillion, up from $27.5 trillion a year earlier.” This is a micro-trend of the greater macro-trend of increasing inequality. The top 0.1 percent and top 1 percent were the only wealth percentiles that grew their share of net worth since 1989, while everyone else declined.
In this light, it’s not surprising that luxury brands would be gaining. Rich people are buying more. If this was a broad retail upswell, we would expect to see that type of growth elsewhere in normal retail. Amazon (AMZN) is only up 2.18 percent (below the S&P 500 average of 5.37 percent). Nike (NKE) is down 1.41 percent, Williams-Sonoma (WSM) is down 6.79, Lowe’s (LOW) is down 9.25 percent, and lululemon (LULU) is down 36.47 percent. The Street reported last month that “it's not exactly the best time in history to be a retailer” as normal retailers struggle. Given that clarity, it’s apparent the rich are getting richer while everyone else is getting poorer. Combined with the rise of poverty profiteers, the more precise observation is that the middle is getting hollowed out. People are falling out of the middle class and into poorer conditions. This coincides with the top 1 to 10 percent of the population getting richer.
As a minor related note, there was also evidence that healthcare providers were doing well while healthcare insurers were declining. UnitedHealth Group (UNH) lost 39.72 percent, Humana (HUM) lost 8.7 percent, and MetLife (MET) lost 4.17 percent. This likely caused by the population aging as the baby boomers enter their final third of life. There will be more need for healthcare products and services for them, but health insurance companies can’t seem to make their math work. More older people equals more care which equals rising insurance costs. Similar to the impoverishment trend, those stocks that profit from an older and enfeebled population will do better while those that pay for it all will do worse.
Overall Analysis
To filter these categories out from the normal market, I went through the entire list and assigned a category tag of either AI, electricity, defense, poverty, luxury, or normal. As stated previously the baseline for the entire market is an average growth rate of 5.37 percent. The top was the AI and defense combination category which only Palantir filled as it is equally both. Next, the poverty category grew at 47.26 percent, defense at 26.31 percent, AI at 26.01 percent, electricity at 12.59 percent, and normal market 2.6 percent. When Palantir is included in AI and defense the average is 29.16 percent for AI and 32.01 percent for defense. I also filtered out the gold-proxy stock of Newmont (NEM) which grew at 56.71 percent as a stand in for bearish sentiment.

There is bound to be some error in my tagging, but it should be generally on the mark. I decided to separate AI and electricity because, while there is a lot of overlap, electricity companies have unique contingencies (especially those outside the geographies with many data centers). The categories of poverty and luxury are much looser than the others. My methodology tried to focus on explicit products and services for each category. Poverty focused on stocks that directly benefit from unemployment and accessible vices. Luxury focused on high-end fashion that exceeded mass retail or athletic attire. While I still think these are worthwhile to exclude from normal, if I include them in normal, the normal average slightly climbs to 3.39 percent.
If we assume these categories are valid, then we are left with some surprising findings. The vast majority of the 441 normal companies in the stock market have only grown by 2.6 percent. They are barely beating the inflation rate of 2.4 percent when we should be expecting the historical average of 7 percent, especially in the context of all the “growth” news. However, that “growth” is sucked up by just a few stocks. Both AI and defense grew at 10 times the normal market. Electricity grew at 5 times, luxury at 12 times, poverty at 18 times, and Palantir at 34 times. As a hedge against this, gold grew at 22 times.
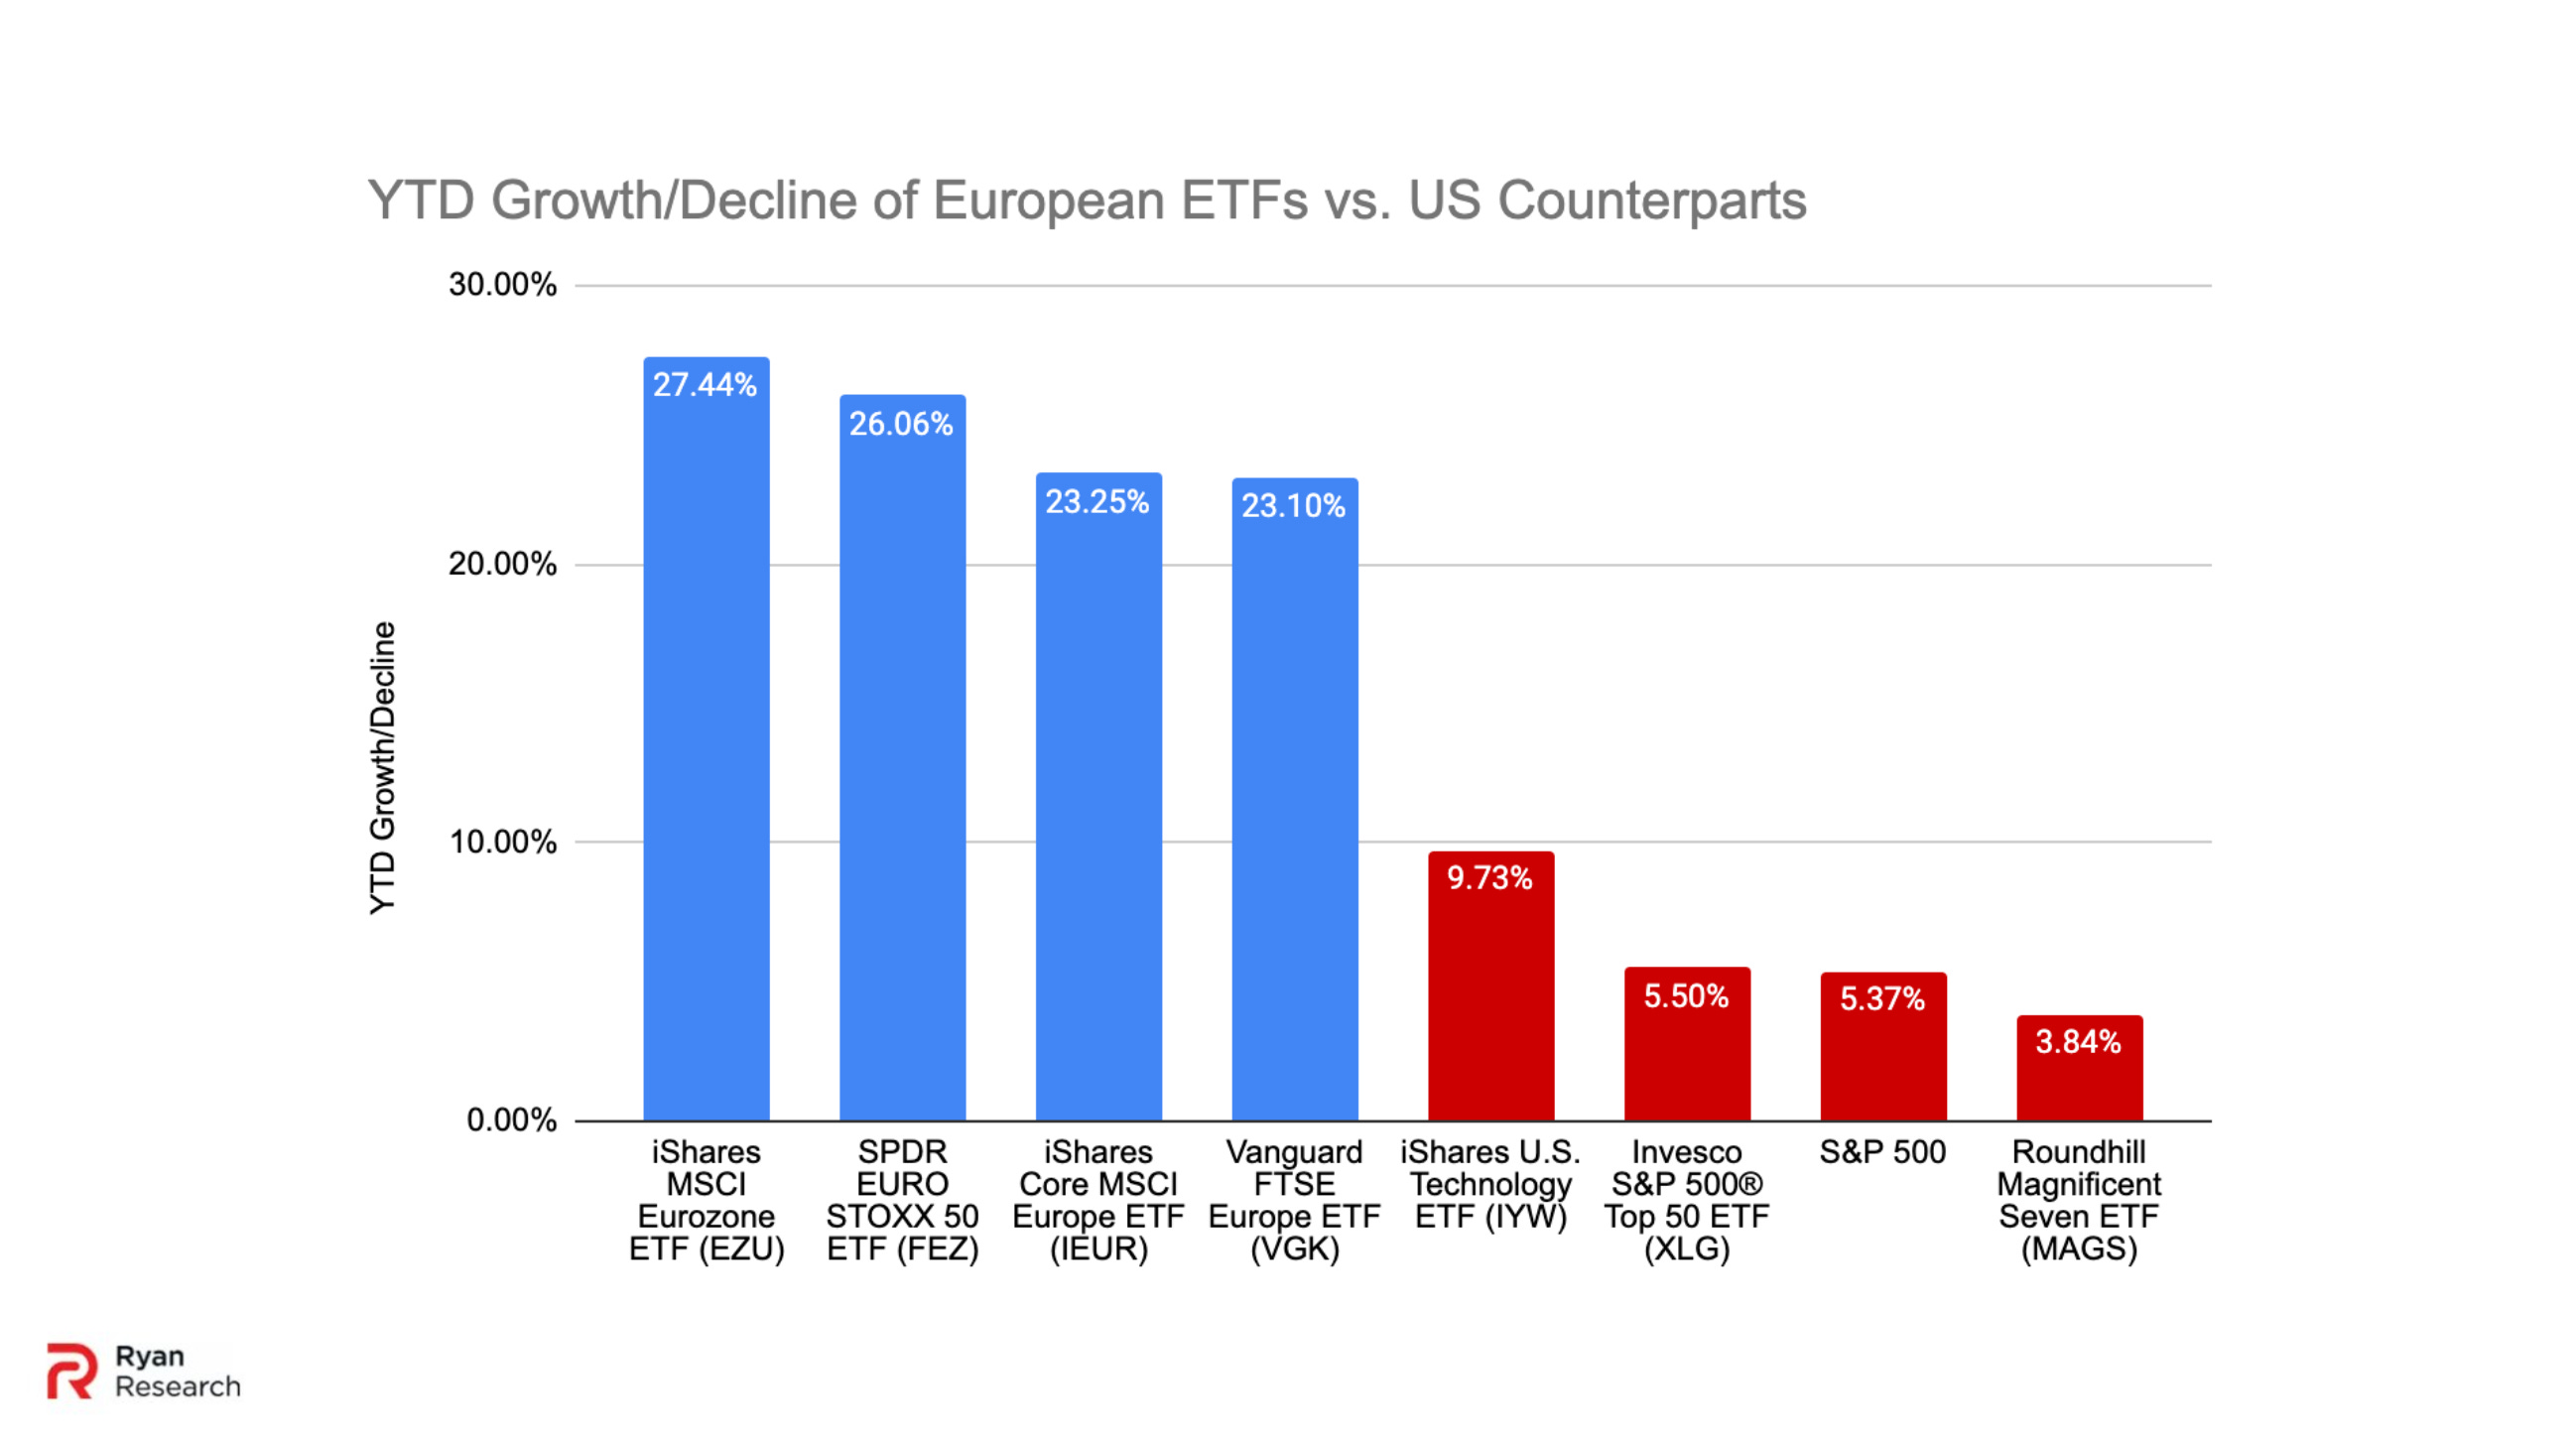
Finally, let’s compare the US’ YTD stock performance to Europe’s. We will use three European market ETFs as proxies. On top, iShares MSCI Eurozone ETF (EZU) grew at 27.44 percent. SPDR S&P 500 ETF Trust (SPY) grew at 26.06 percent. iShares Core MSCI Europe ETF (IEUR) grew at 23.25 percent. Vanguard FTSE Europe ETF (VGK) grew at 23.10 percent. The average of the European ETFs of 24.96 percent grew about 5 times that of the US’ S&P 500. Other US-focused ETFs that focused on higher ends of the market like technology, the top 50 by market cap, and the Magnificent 7 didn’t show much better performances compared to European ETFs. For all the narratives around US “growth”, somehow Europe is not just beating the US but beating it badly.
Why is this happening? Could it be that Europe is in even more of a speculative frenzy? This is happening because European stocks look like better investments to hold than US stocks. According to the Financial Times:
“The dumping of US assets in favour of Europe’s resurgent markets signals the start of a much longer-term move by pension funds and other big institutional money managers to cut back their huge exposure to dollar investments, say investors. Wall Street banks say they are seeing signs that investors managing trillions of dollars of assets are starting to trim their US positions, on concerns over erratic policymaking, President Donald Trump’s attacks on the Federal Reserve chair and the fallout from the trade war…A Bank of America survey showed that investors made the ‘biggest ever’ cut to US equity allocations in March, while the shift out of the world’s biggest economy and into Europe was the sharpest since 1999.”
This trend is also why the US dollar is down 11 percent to the euro from the start of this year. JP Morgan also noted that European stocks are more heavily weighted towards industrials and financials contrasting the US’ heavy weighting on technology which is attractive for investors seeking to diversify. They also mentioned that the “European benchmark offers a dividend yield approximately 200 bps higher than the S&P 500, making these stocks potentially attractive to clients who prioritize income.” Further, in a slight similarity to the US, German-led defense spending has signaled potential new growth. However, this spending appears to be more coupled with overall European infrastructure spending rather than just the freebees prevalent in the US military industrial complex.
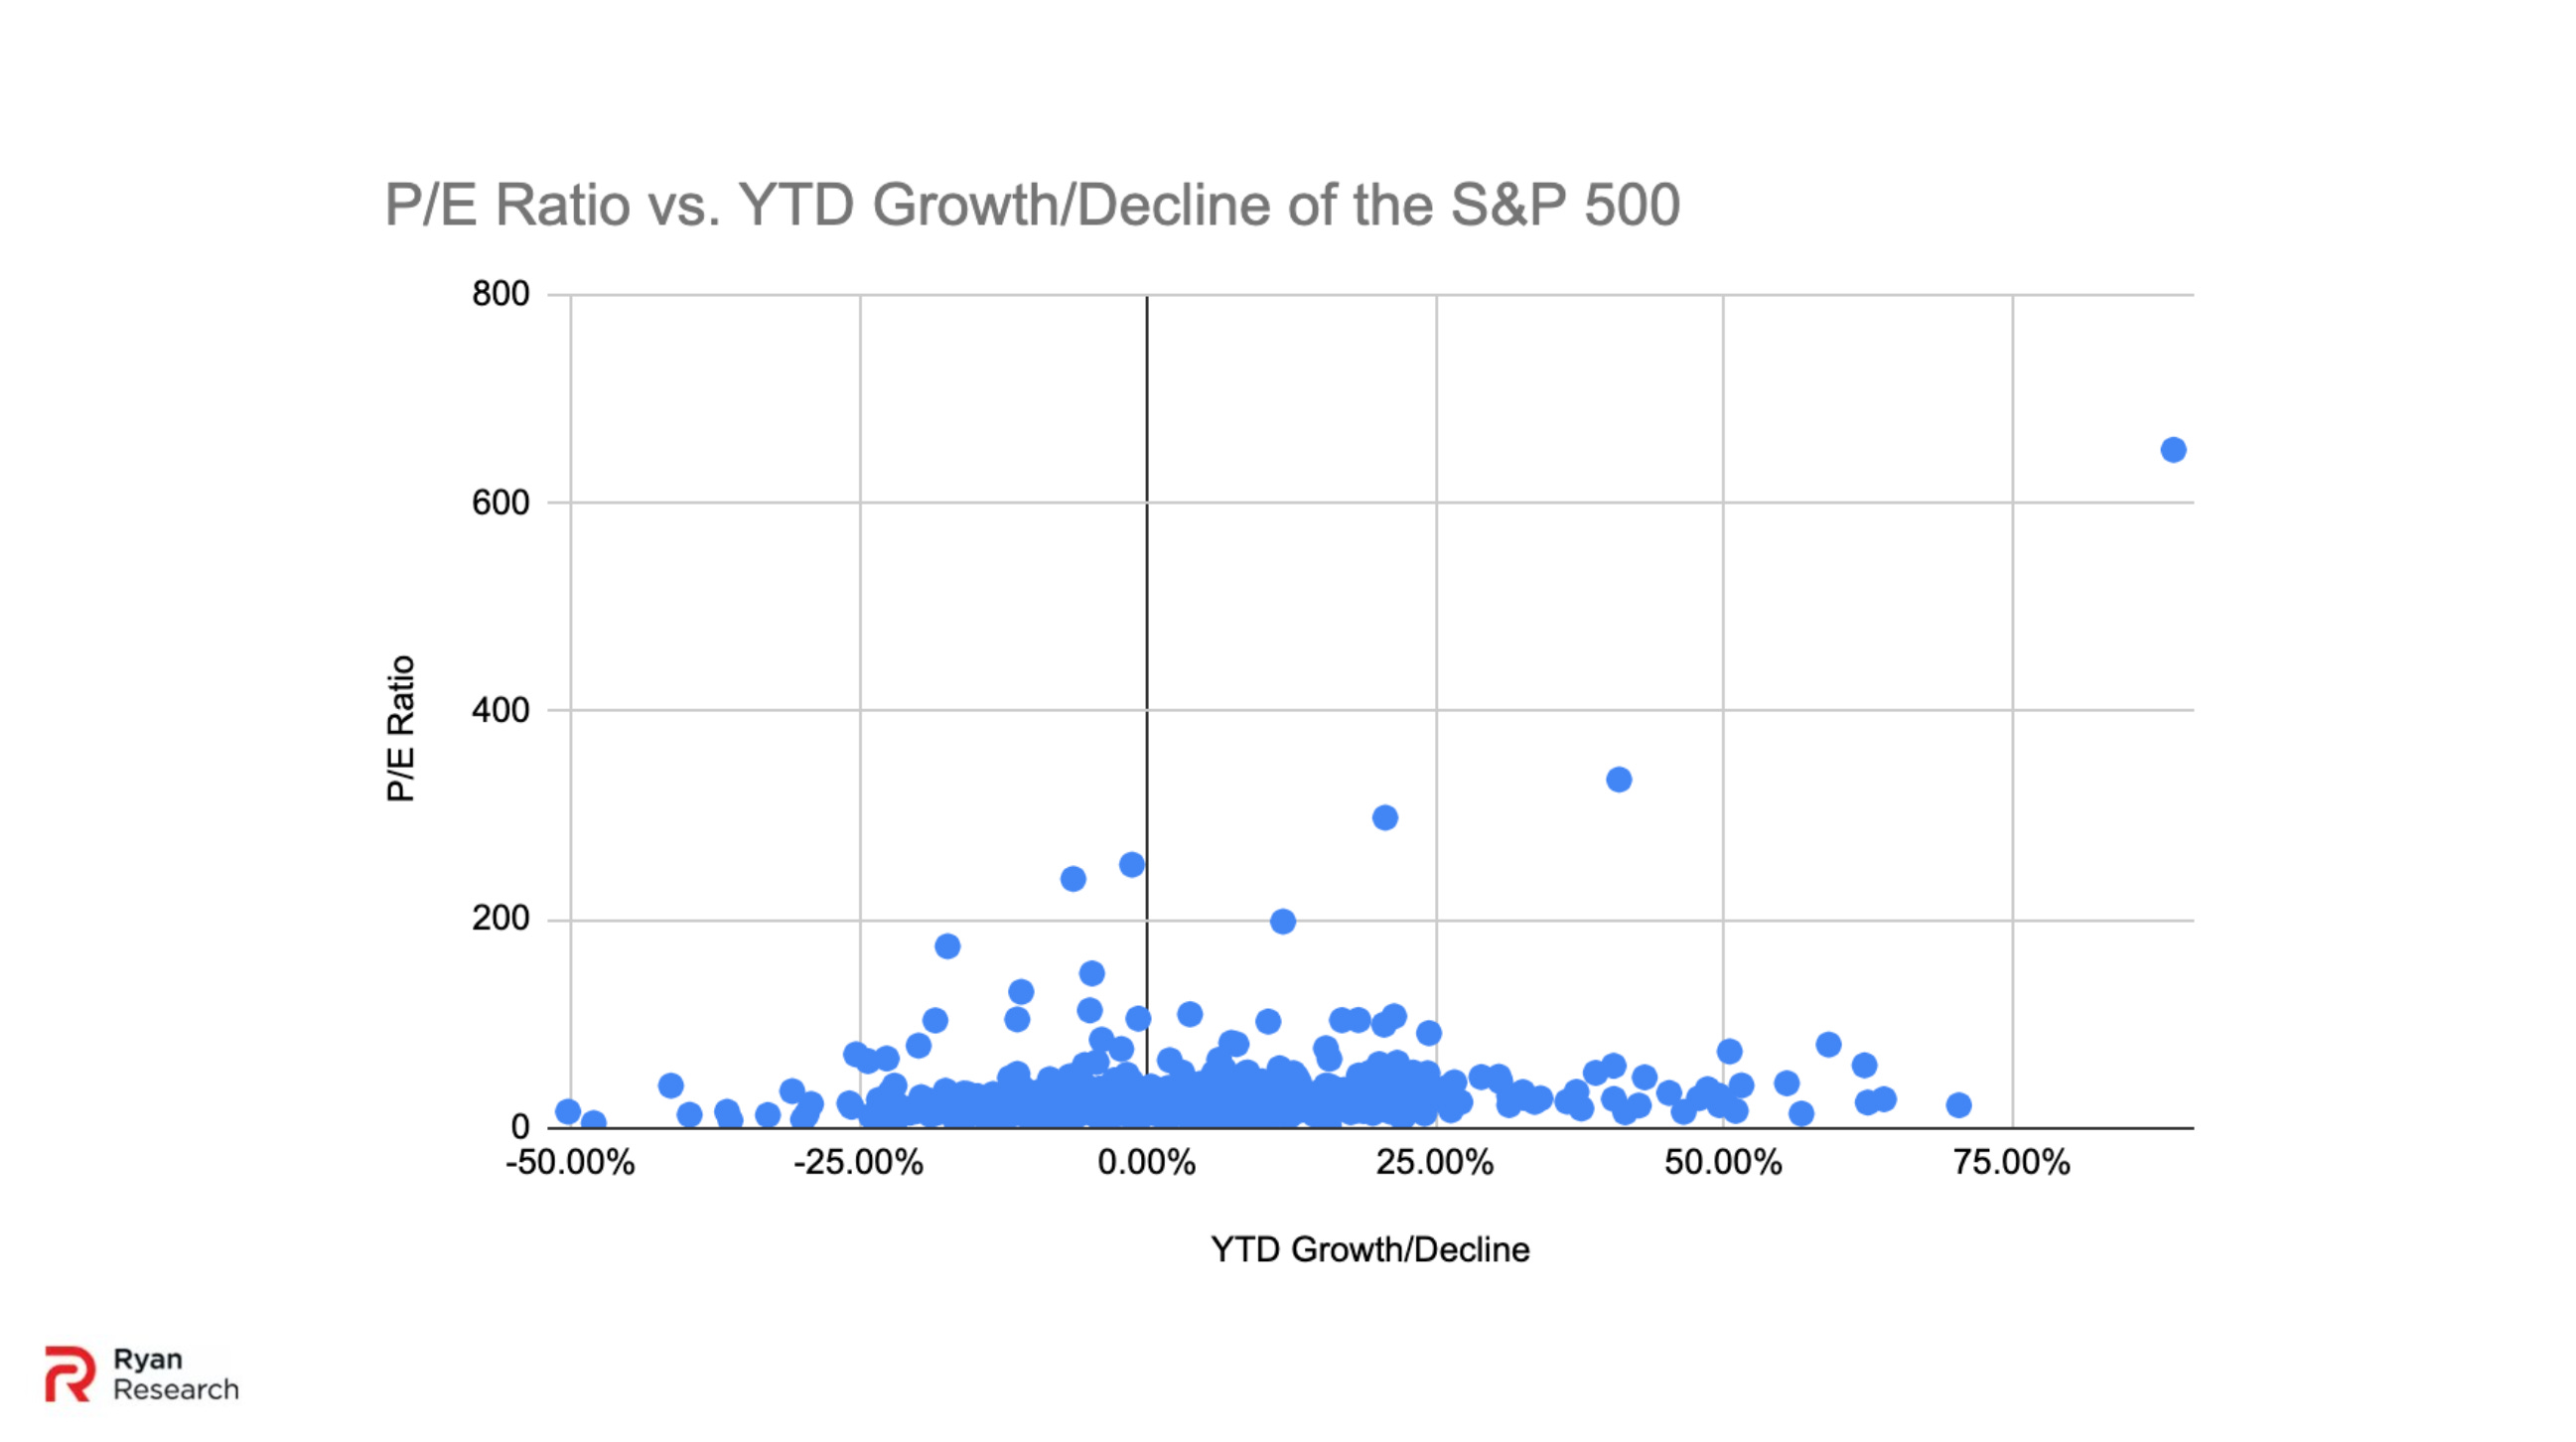
European stocks are seen as undervalued relative to US stocks. Traditionally, a fair value P/E ratio hovers around 10 to 20. If a stock’s P/E ratio is under 10 then it’s very undervalued, under 15 then moderately undervalued, over 15 then moderately overvalued, and over 20 then very overvalued. Since 1950, the S&P 500’s average P/E ratio has been 19. Since 2000, the average has been 25. The current average P/E ratio is 34. About 30 percent of the S&P 500 falls under a ratio of 20 meaning 70 percent is over it. Perhaps it’s really not that surprising that Palantir once again tops the list with a P/E ratio of 651. Going down the list, Coinbase pops up with a ratio of 73, Howmet with 60, and NVIDIA with 53. The AI category has an average ratio of 41, electricity with 25, the defense category with 32, poverty with 97, and luxury with 26.
There was certainly a justifiable premium placed on US stocks historically given the global status of US companies. However, this premium seems to be very out of whack today. In contrast, the Vanguard FTSE Europe ETF (VGK)’s P/E ratio is 17 with a 20-year average of 12. Given that Europe deserves somewhat of a developed world premium as well, European stocks are relatively undervalued compared to US stocks with room to grow.
Taken altogether, the US stock market’s major growth is coming from AI speculation, its derivative electricity sellers, government defense spending, the impoverishment of the general population, and the increased luxury consumption of the rich. All this while the rest of the market is left stymied. If we were to find a similar catchy acronym like FAANG or MAG7, at first glance it looks like AI, Defense, and Poverty (ADP) makes sense. But if we were to play around with some of the components and vocabulary, we could devise another version. How about Electricity, Violence, Intelligence, and Languishment/Luxury (EVIL)? Someone make that an ETF!
Conclusion
Economist Michael Hudson described the current state of the American economy as:
“If America were to do that strategy of raising industrialization, increasing employment and living standards, that would free the American economy from this billionaire class that we’ve been talking about for the last half hour. The billionaire class is — think of it almost as a tumor on the economy, as a parasite. They pretend to be part of the real economy of production and consumption. They pretend to be helpful, and even necessary, for industry to take place. But they’re not helpful at all. They’ve led the de-industrialization of the country. And so, of course, what we’re dealing with is almost a civilizational conflict now between a society…run by billionaires who make money by de-industrializing the economy, and squeezing living standards, and driving the wage-earning force further into debt so that it can’t afford to buy the products that it makes, on the one hand.”
Hudson’s critique would square very nicely with this essay’s analysis. A group of very wealthy investors are driving finance capital to unproductive speculation and government largess while the rest of the economy stagnates or declines. An elite investor class is also gaining immense asset wealth from structuring the market this way. Economists Jonathan Nitzan and Shimshon Bichler developed the power index to illustrate the rise and fall of this elite power. It is the stock index divided by the average wage. The stock index, as a proxy for wealth primarily held by the elites, surged past equality with the average wage in the 1980s and we are currently at an unprecedented peak. If the normal market was gaining from all this “growth”, shouldn’t there be wage growth that would offset the extremely high stock growth?

In absence of that, the current growth doesn’t seem to be very productive at all and is possibly making the real economy worse. To paraphrase Adam Smith, wealth “is always highest in the countries which are going fastest to ruin.” As mentioned earlier, the top 0.1 percent and top 1 percent were the only wealth percentiles that grew their share of net worth since 1989, while everyone else declined. The elites are using stock market more like an artificial gimmick to pump up paper wealth rather than a conduit for real productive investment. The YTD results appear to only compound Hudson’s, Nitzan’s, and Bichler’s conclusions. Since YTD is synonymous with President Trump taking office, it’s only logical to associate him with these results.
This analysis was also an evaluation of President Trump’s effect on the stocks. His administration has had a big impact. Most notably, tariffs are hurting many normal companies. Second, the aforementioned high growth categories have received special catering by him. Trump has claimed ownership of the stock market growth on previous occasions like on 19 January 2025 when he said, “Everyone is calling it…the Trump effect. It’s you. You’re the effect. Since the election, the stock market has surged.” He has been the one talking most about all the “growth” in the market. If we are to take the President at his own words, then we can only deduce that his “Trump effect” has shaped this distorted market. Even discounting his causative role, one could certainly see him as a symptom of it.
In conclusion, Trump’s stock market is much less healthy than the surface level would suggest. US stocks are overvalued to European stocks. US stocks are more weighted to speculative AI bets and government welfare spending on defense. In addition, companies that cater to people languishing, whether in underemployment or vice sectors, are the ones doing well while middle class oriented normal retail struggles. Inversely, some luxury brands that cater to a more enriched wealthy elite are also gaining. As the bottom 90 percent do worse, the upper 10 percent and 1 percent are doing much better. No doubt thanks to their speculative financing and government sinecures pumping up their chosen assets. The growth of their nominal asset wealth is a product of malinvestment that is increasing inequality and reducing the prosperity of the general population. As Adam Smith alluded, this is the road to ruin. Rather than this making the economy better, it is making it worse with the thinnest veneer of “growth.” Just like a rotting corpse filled with gas after expiring, this market is bloated.
If you would like to review all the data I used in this essay, you can access the spreadsheet if you buy a paid subscription. The link to access the spreadsheet will be under this section, once you become a paid member. Thanks!
If not, please like, share, and join as a free subscriber, here: